Forecasting the Weather—Activity
Complete the Weather Activity
- You may work with a partner
- Read the directions & examples carefully
- On note book paper, write out the question followed by a complete answer.
- You can use your weather symbols Page, glossary (@ the bottom of this post), weather prediction tips (@ the bottom of this post), & notes to assist you.
- We will discuss questions in class. Be ready to answer!
 Introduction
Forecasting the weather can be a tricky problem. Meteorologists gather data from many weather stations, plot the data to draw lines for air masses and pressure systems, and then analyze the map to make the forecast. The trick is that air masses move in different ways and change in ways that are not easily predicted.
The key to forecasting the weather is knowing how large bodies of air with similar temperature and pressure properties (air masses) react to different environmental conditions. These air masses “set up” weather conditions. Of course, many environmental factors such as wind patterns, wind direction, or seasonal changes, affect the weather, too.
This lesson will take you through the properties of certain features in our atmosphere that will allow you to forecast the weather using a weather map.
Objectives
You will:
- Understand how the properties of large air masses can affect weather.
- Recognize weather symbols and apply them to a forecast.
- Be able to forecast the weather for the next several days when provided with a weather map for the present day.
- Know how geography affects the weather of a region.
- Predict the weather using weather data and weather maps.
Materials
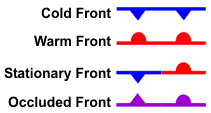
- Weather Symbol Reference Guide
- Weather Prediction Tips & Clues
- Weather Glossary (bottom of post)
- Pen or pencil
Procedure
1. Read the following explanations of atmospheric features and the weather they produce. Keep these in mind when you work the weather maps in this lesson to make your own forecasts. Refer back to them if necessary
Above 32 degrees F— rain
Below 32 degrees F— snow
- Warm air rises because it is less dense than colder air. As the air rises, it cools and the moisture condenses, forming clouds.
- As more moisture is added to clouds, the moist drops become larger and eventually are too heavy to remain aloft. If the air happens to be cooled from a cold front or other drop in temperature, moisture will fall from the clouds as precipitation. (Cool air can not hold as much moisture as warm air.)
- The type of precipitation that falls to Earth depends on the temperature:
The type of precipitation also depends on the movement of the moisture through the layers of our atmosphere:
- If the water droplet is thrown up repeatedly through colder layers of air, hail forms.
- If rain passes through a colder layer of air near the ground, sleet forms.
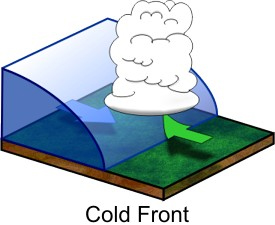
Two air masses do not mix well because of differences in temperature and pressure. A front is formed and usually produces stormy weather.
Cold fronts occur when cold air masses move into warm air masses. Cumulus clouds with showers or thunderstorms form along cold fronts. As the front moves along, skies clear and air temperature falls.
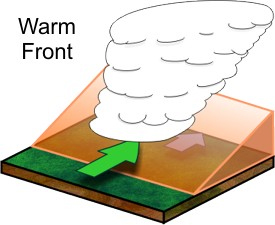
Warm fronts occur when warm air masses move into cold air masses. Cirrus clouds and later stratus clouds appear producing rain or snow and air temperature rises.
Stationary fronts are boundaries of air masses that are not moving. Precipitation and weak winds are usually produced.
High pressure areas usually produce fair, sunny weather.
Low pressure areas usually produce clouds and precipitation.
Differences in air pressures of air masses result in moving air—wind.
A word about Geography:
1. Fronts, air masses, seasons, and wind currents greatly affect weather systems. Local weather is also determined by geography.
Do you live near a body of water?
Do you live near hills or mountains?
These geographical features influence how air masses act and can produce weather that you wouldn’t expect.
Do you live near a body of water?
Do you live near hills or mountains?
These geographical features influence how air masses act and can produce weather that you wouldn’t expect.
2. Read the following explanations about a few geographical features that influence local weather and use these clues along with the clues above to forecast the weather from the maps in this lesson.
- For the United States, most weather moves from west to east due to wind patterns. Although not true all the time, most weather for the next day can be forecasted by looking at the weather to the west.
- Large bodies of water affect local weather. Water can retain heat longer than land. Areas near the coasts may be warmer than areas even short distances away. Water can also remain cold longer; in winter or spring, coastal regions may be colder due to winds coming off cold water.
- Hills and mountains cause different local wind patterns. Hot air moves up the slope during the day and down the slopes at night as the air becomes more dense as it cools.
- If air moving up a hill or mountain is moist, it may produce precipitation as it cools at higher elevations. Therefore, the air that moves on to the other side of the hill or mountain is then dry.
- Buildings and pavements of large cities hold heat more than the vegetation of rural areas.
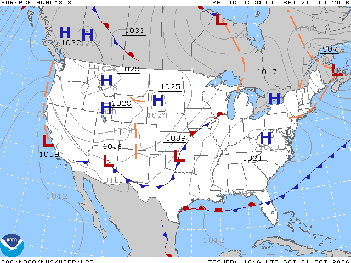
3. Now apply what you know about air masses, weather fronts and geography to the maps that follow.
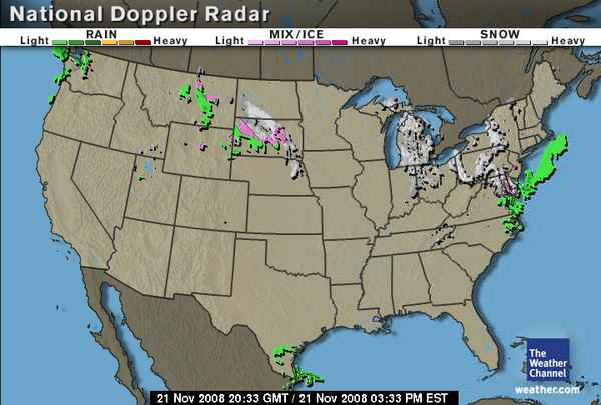
Answer the questions about forecasts for the states or areas on the following maps.
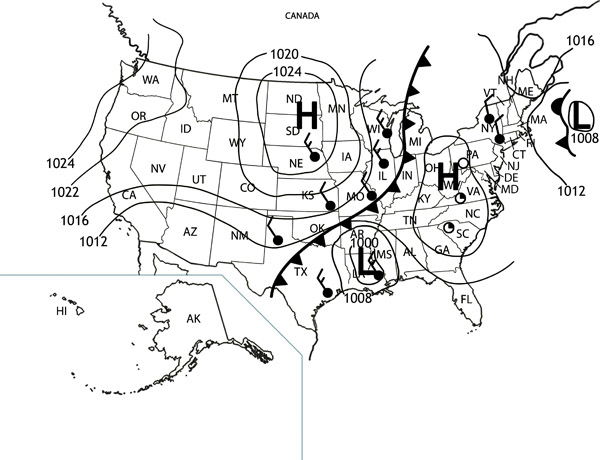
Answer the questions about forecasts for the states or areas on the following maps.
1. What is your forecast for most of Ohio, West Virginia, and Pennsylvania?
2. What kind of front is affecting the area directly to the west of OH, WV, and PA?
3. What kind of weather will this front probably bring to the area?
4. Forecast the weather for Louisiana and SE Texas.
5. If the high pressure area over the Dakotas and Nebraska was not labeled, how would you still know it was an area of high pressure?
6. Using the same reasoning as you did in #5, find another area on the map that would be experiencing high air pressure. Name that area.
***********************************************************
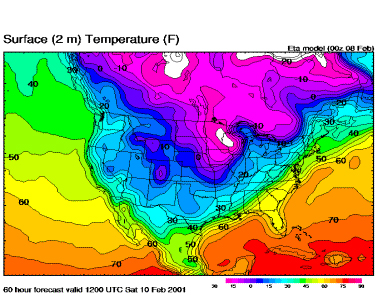
Weather Map #2
The map below shows the weather 3 days later.
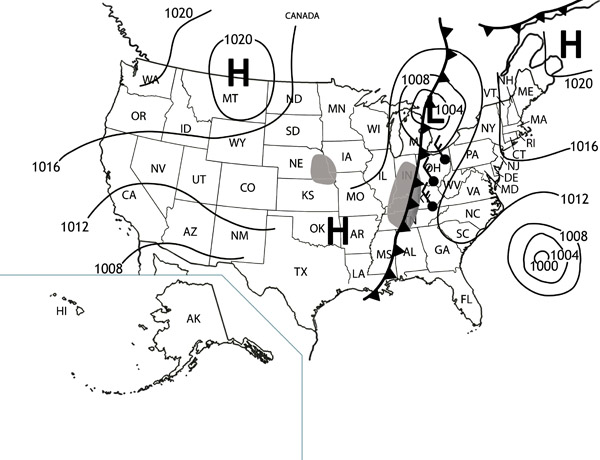
The map below shows the weather 3 days later.
1. How has the weather changed in Ohio, West Virginia, and Pennsylvania from 3 days ago?
2. Forecast the weather in the mid-west region affected by the cold front.
3. How has the weather changed in the Louisiana and SE Texas area?
4. What kind of pressure area is centered off the coast of South Carolina, Georgia, and Florida?
How did you know that?
5. a. What kind of pressure area is affecting the states on the east coast?
b. Forecast the weather for those states.
c. How long should that weather last? Explain.
6. Compare the two maps in this activity. What direction does weather seem to move across the continental United States?
7. How would geographical factors affect the weather in Ohio, Pennsylvania, or West Virginia? (Name a major geographical feature of this area and explain how that might affect the weather.)
8. How would air moving in to the northwest area be affected by geographical features?
Glossary
advisory—an alert issued during severe weather events to warn the public about dangerous conditions. The advisory recommends actions that could prevent accidents or injuries.
acid precipitation—precipitation with a pH that tends toward the acidic; precipitation of a pH of lower than 7.0.
air mass—a large body of air having similar temperatures and moisture content.
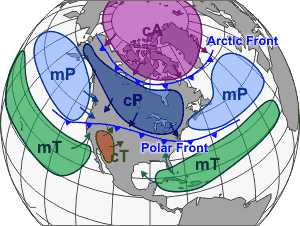
cP = continental Polar
(over land) (cold)
cT = continental Temperate
(over land) (warm)
mP = maritime Polar
(over water) (cold)
mT = maritime Temperate
(over water) (warm)
Air masses are classified according to temperature and location.
• Temperatures of air masses are either cold, (Polar) or warm, (Temperate).
• Locations are either over land, (continental) or over water (maritime)
• Temperatures of air masses are either cold, (Polar) or warm, (Temperate).
• Locations are either over land, (continental) or over water (maritime)
air pressure—the force caused by the weight of air; measured by a barometer.
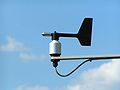
anemometer—an instrument that measures wind speed.
|
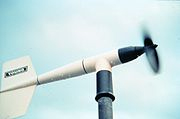 Windmill-style anemometer
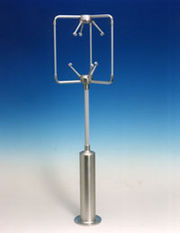
barometer—an instrument that measures air pressure.
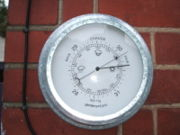
Modern aneroid barometer
base flood—a flood having a 1% chance of being equaled or exceeded in any given year.
Beaufort wind force scale—a scale, from 0—12, used to describe wind strength by observing its effects on land and sea conditions.

Beaufort Scale Level 0 image
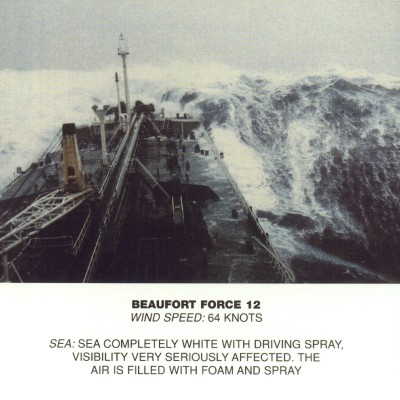
Beaufort scale level 12 image
breakaway wall—a wall that is not part of the structural support of the building and is intended to collapse under certain forces without causing damage to the other parts of the building or foundation.
category—in weather, a term that describes the strength of a hurricane; Category 1 (lowest strength) to Category 5 (greatest strength).
Celsius—temperature scale at which water boils at 100 degrees and freezes at zero degrees.
climate—the average of all weather conditions of an area over a long period of time, usually 30 years.
clouds—collections of water droplets suspended in the air.
cold front—a boundary that forms when a cooler air mass replaces a warmer air mass.
condensation—the process of gas changing to liquid.
convection—vertical air circulation where warm air rises and cool air sinks.
dew point—the temperature to which air must be cooled for water vapor to condense (change to liquid).
Doppler radar—a type of radar that "sees" rain and snow and measures wind speed and direction.
evacuate—having to leave your home and area in an emergency in order to be safe.
eye—the calm center of a hurricane.
Fahrenheit—temperature scale at which water boils at 212 degrees and freezes at 32 degrees.
Federal Emergency Management Agency (FEMA)—the federal agency within the Department of Homeland Security that responds to and plans for emergencies, such as natural disasters.
flash flood—a sudden rush of water into an area caused by heavy rainfall, break in a dam, or release of an ice jam.
flash flood warning—issued whenflash flooding is actually occurring. A warning can be issued as a result of heavy rains, a dam failure or snow thaw.
flash flood watch—issued whenflash flooding is possible.
flood—a rising and overflowing of a body of water especially onto normally dry land.
flood warning—issued when flood conditions are actually occurring in the area that at time.
flood watch—issued when an overflow of water onto normally dry land is possible.
Flood Zone (Zone)—an area on a map that shows the amount or type of flooding.
 floodplain—any land area susceptible to being flooded from any source.
floodplain management—the plan for reducing flood damage in a floodplain, including emergency preparedness plans, flood control works, and floodplain management regulations.
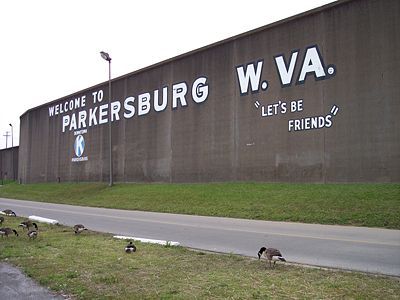
floodwall—a man-made vertical barrier constructed to contain the waters of a river or other water source which may flood during seasonal or extreme weather.
Floodwall in Parkersburg, WV along the Ohio River.
|
hail—precipitation that forms when droplets of water freeze in layers around a small nucleus of ice. Hailstones grow larger when they are tossed up into colder layers of the atmosphere by rising and falling air currents.
gage—an instrument for measuring water levels in a river, creek, lake, or stream.
hectopascal—a unit of measure used in meteorology to measure air pressure. Meteorologists use hectopascals (hPa) which are equal to millibars, the former unit of measure although millibars may still be used for informal weather reports.
hemisphere—either the northern or southern half of the Earth as divided by the equator, or either the eastern or western half of the Earth as divided by the prime meridian.
hemisphere—either the northern or southern half of the Earth as divided by the equator, or either the eastern or western half of the Earth as divided by the prime meridian.
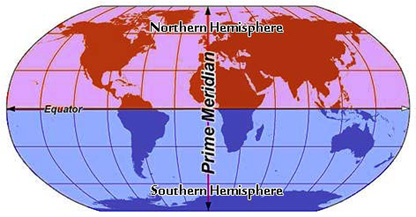 North and south hemispheres North and south hemispheres |
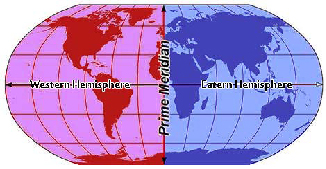 East and west hemisphere East and west hemisphere |
highs—areas of atmosphere that have higher air pressure than the surrounding areas.
humidity—The amount of water vapor in the atmosphere (see relative humidity).
hurricane—a tropical cyclone with winds of 74 miles (119 kilometers) per hour or greater that occurs especially in the western Atlantic, that is usually accompanied by rain, thunder, and lightning.
hydrologist—a scientist who studies hydrology.
hydrology—the study of the circulation, distribution, and properties of water on and in the Earth and in the atmosphere.
hygrometer—an instrument that measures humidity.
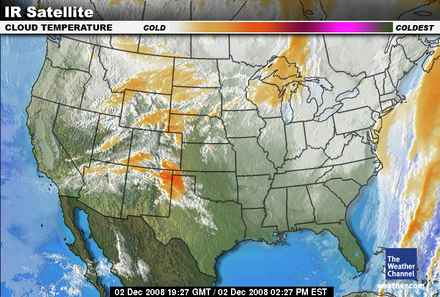
infrared radiation—an invisible form of radiation given off by all objects both day and night. Satellites equipped with infrared sensors take images of clouds and of the Earth's surface.
isobar—a line on a weather map connecting points of equal air pressure.
isotherm—a line on a map joining areas of equal temperature.
This weather map has isotherms and color added to further show temp differences.
http://www.atmos.umd.edu/~meto200/2_6_03_lecture_files/slide0060_image190.gif
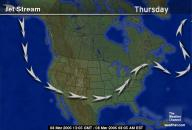
jet stream—high-speed bands of wind in the upper troposphere layer of the atmosphere. The jet stream often "steers" surface features such as fronts and low pressure systems.
knots—One knot = 1.15 miles per hour. Meteorologists use knots to describe wind speed. Knots are also used to state the speed of ships, boats, and aircraft.
lift—cold fronts, warm fronts, sea breezes, mountains, or the sun's heat are capable of lifting air to help form storms.
lows—areas of atmosphere that have lower air pressure than the surrounding areas.
meteorologist—a person who studies the atmosphere and the processes that cause weather.
microclimate—a climate over a small area of Earth’s surface; microclimates are affected by surface features, such as mountains, valleys, bodies of water, or the presence of a city.
millibar—a unit of air pressure. Average sea level pressure is approximately 1013 millibars.
MPH—miles per hour
NOAA—National Oceanic and Atmospheric Administration
occluded front—a front that forms when a cold front catches up to a warm front.
precipitation—liquid or solid water molecules that fall from the atmosphere and reach the ground.
relative humidity—a percentage that compares the amount of moisture in the air to the amount of moisture the air can hold at that temperature.
ridge—a surface high steered by the jet stream. Ridges bring generally warm, clear weather. When looking at a weather map, you can recognize a ridge by its shape ( ).
Saffir-Simpson Hurricane Scale—a scale used to estimate possible hurricane damage based on conditions during the life of the storm.
Category
|
Central Pressure (mb)
|
Wind Speed (mph)
|
Storm Surge (ft.)
|
Damage
|
1
|
980 or >
|
74 - 95
|
4 - 5
|
Minimal
|
2
|
965 - 979
|
96 - 110
|
6 - 8
|
Moderate
|
3
|
945 - 964
|
111 - 130
|
9 - 12
|
Extensive
|
4
|
920 - 944
|
131 - 155
|
13 - 18
|
Extreme
|
5
|
< 920
|
> 155
|
> 18
|
Catastrophic
|
saturation—the condition of air when it contains all the water it can hold at a certain temperature. When air is saturated, the relative humidity is 100 percent.
stage—the surface water level of a body of water. The measurement is sometimes used as an indication of water levels upstream and downstream to the next nearest gage. The measurement can also be used to indicate the water level status of other streams in the general area that have similar characteristics as the measured stream.
stationary front—a front that is not moving.
storm surge—a massive wave of water that sweeps onto land where the eye of a hurricane comes ashore. A storm surge is often 50 miles wide. It is one of the most dangerous hazards for people living along the coast.
surface winds—winds located from ground level to approximately 3,000 feet.
temperature—the degree of hotness or coldness of a substance; temperature is the most measured characteristic of the atmosphere.
thermometer—an instrument for measuring temperature; weather thermometers use either the Fahrenheit or Celsius scale.
thunderstorm—a violent weather system that produces gusty winds, lightning, and heavy rain. Thunderstorms occur along fronts where air is rapidly rising.
tornado—funnel-shaped clouds with violent winds moving over land.
tropical depression—a tropical cyclone-like weather formation that is weaker than a tropical storm, with wind speeds of 38 mph or less.
tropical storm—a tropical cyclone with less than hurricane force.
trough—a surface low steered by the jet stream. Troughs bring generally cool, cloudy weather. When looking at a weather map, you can recognize a trough by its shape ( ).
unstable air—warm air near the ground and cold air above. Unstable air can lead to billowing clouds and storms.
upper air temperatures—most precipitation forms approximately 5,000 feet above sea level, where the air pressure is 850mb (millbars). Temperatures at this level affect the type of precipitation that forms.
water vapor—water as a gas in the atmosphere. Data from satellites measure the water vapor in our atmosphere by using infrared waves and create an image.
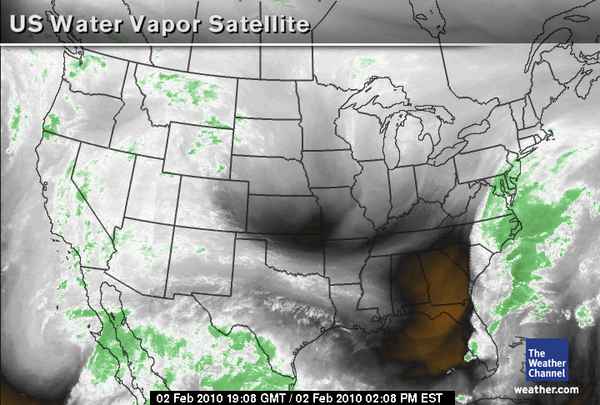
http://www.weather.com/maps/maptype/satelliteusnational/uswatervaporsatellite_large.html?clip=undefined®ion=undefined&collection=localwxforecast&presname=undefined
warmfront—the boundary between a warm air mass that is moving toward a relatively older air mass.
weather—the condition of the atmosphere over a short period of time. It results from the variations in the air pressure, wind, temperature and moisture.
wind—moving air.
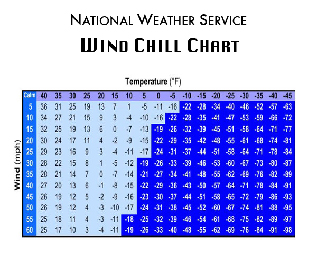
wind chill—a measure of the rate of heat loss from exposed skin caused by the combined effects of high winds and low temperatures.
wind vane—an instrument that shows the direction from which a wind is blowing.
 | |
Weather Prediction Tips
A weather map is a good tool for finding out about current weather conditions. By understanding why and how air masses move, you can also use the map to forecast weather.
Use the following table to help you forecast the weather when you work on the practice weather maps for the WV STORM simulation or during the mission. Pay attention to how air masses move, their characteristics, and the weather they produce. Air masses react predictably.
Measurement or trend
|
What’s happening
|
Weather possibility
|
Rapidly falling air pressure
|
Low-pressure system moving in
|
Storms, wind, precipitation (storm likely in 5—6 hours)
|
Slow, moderate and on-going drop in air pressure
|
Low pressure system will not move out quickly
|
Extended period of poor weather; precipitation likely
|
Rapid, large drop in air pressure
|
Low pressure system will come into an area quickly
|
Poor weather will enter an area soon
|
Rising air pressure
|
High pressure system moving in
|
Fair and dry weather
|
Falling temperatures
|
Cold front approaching
(air holds less moisture) |
If relative humidity is high enough, precipitation will result (cool air cannot hold as much moisture)
·If the temperature is above freezing, rain forms
·If the temperature is below freezing, snow forms
·If the temperature is colder as the water falls, sleet forms
·If water droplet is thrown upward repeatedly by updrafts, hail forms
·If temperature is at dew point, frost will form
|
Rising temperatures
|
Warm front approaching
(warm air holds more moisture)
|
May indicate fair weather (if air pressure is stable)
|
Warm, moist air mass moves into colder, dry air mass
(warm front)
|
Quick uplift produces electric charges
|
Lightning forms (in thunderstorms)
|
Expanding air forms pressure wave
|
Thunder forms
| |
Cold air mass moves into a warm air mass
(cold front)
|
Less dense (warm) air is forced up, cools, and drops moisture
|
Precipitation (type depends on the temperature)
|
Stationary front
|
Air masses do not move
|
Weather remains the same
|
Dew Point
|
If the difference between the dew point and temperature is small, there is more moisture in the air
|
Clouds and fog are more likely to form
Precipitation is more likely
|
The higher the dew point, the more moisture in the air
|
Precipitation may occur
| |
High dew point and high relative humidity
|
BEST scenario for rain (if temperature is not too low for liquid precipitation)
| |
Wind speed
|
If winds are low, air masses will not move quickly
|
Weather conditions stay the same over an area
|
If winds are fast, air masses move more quickly
|
Weather conditions change quickly and are not long-lasting
| |
Wind direction
|
If an air mass comes from an area that is warmer and over a body of water, humidity and dew point increase
|
Warm air rises, cools, and condenses to form clouds. Updrafts could cause thunderstorms
|
These tips help you start the puzzle of weather prediction.
REMEMBER! All weather measurements have to be considered before you can make an accurate forecast!